Built-in LMS Reporting Dashboards Plugin for WordPress
AccessAlly offers integrated sales and LMS reporting dashboards for your WordPress site, so you can track the effectiveness of your efforts and your students’ progress from the initial purchase to retention and engagement metrics.
Review LMS Progress and Reports With Ease
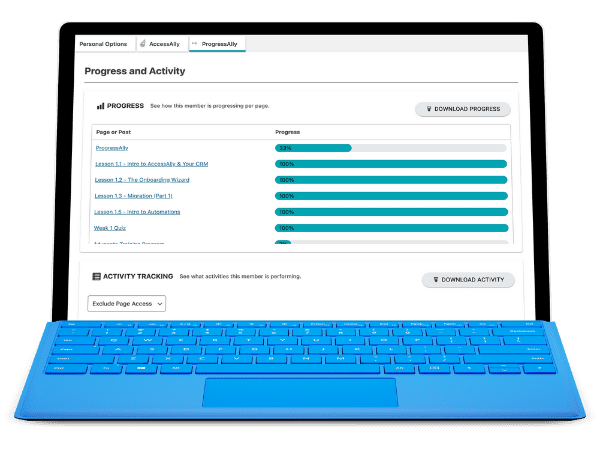
Whether you have one course or one hundred, you can monitor student progress and engage 1-1 with members through an LMS reporting dashboard. Filter by course or another identifier, and answer any questions or homework notes they send your way.
Use the retention and churn tracking metrics within AccessAlly to gather insights to help you retain your students and members even longer.
We understand the complexity of managing a course, and we know it’s difficult to cobble together multiple WordPress plugins so that you can have all the features you need to deliver an organized, engaging student experience.
With our built-in LMS reporting dashboards, we’ve made it easy and fun for you to browse through your student roster and focus on building and growing your community.
Here is a snapshot of the features that will help you keep your users engaged and grow your revenue:
- Filter student progress by course
- See student progress updated in real time
- Review quiz scores
- Review and reply to homework submissions
- Tightly integrated with popular CRM and email software platforms (so you can use email automation to keep students engaged if they lag behind)
- Revenue reporting via customizable dashboards
- Share LMS dashboards with coworkers or other instructors, so they can help monitor students’ progress
That’s a lot of goodness, right? Did we mention you can add all users to a single dashboard or create multiple, targeted dashboards? Plus our LMS never caps the number of students or courses you have, so you can easily scale.
How does the WordPress LMS reporting dashboards plugin work?
With AccessAlly installed on your site and your content ready to go, setting up your first LMS reporting dashboard takes just minutes.
You can add filters to your dashboard based on your courses, membership level, or another identifier, such as location or grade.
Then, start adding the elements you’d like to appear alongside each student. Choose from quiz results, progress updates, or even record the last time they logged in; whatever you need, as an administrator, to successfully manage your students and members.
Since the dashboard can be added to any page on your WordPress site, you can give other teachers or team leaders permission to access the reporting dashboard. This becomes especially helpful if you need help reviewing homework submissions or sending out 1-1 communications through the dashboard to a large number of students.
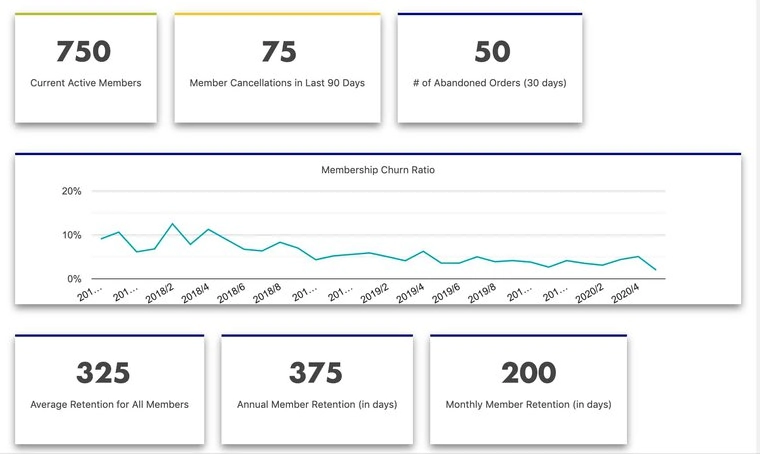
Admin users can also create a metrics dashboard that tracks sales, cancellations, churn rates, retention, and more. Use it to inform your next strategy for engagement and community growth.
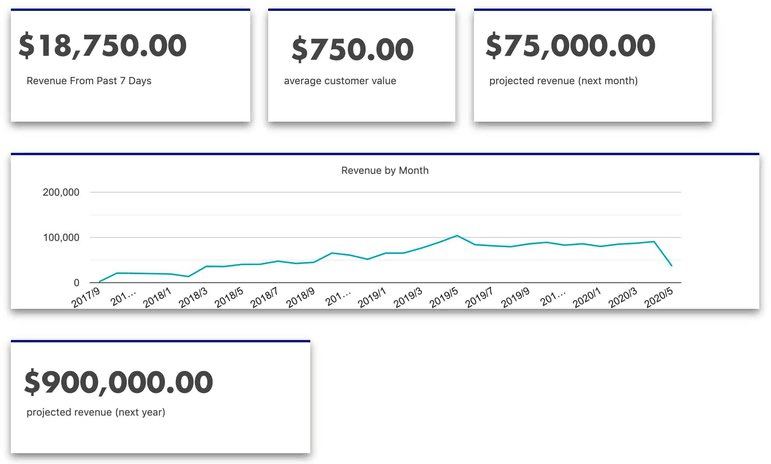
Beyond the LMS reporting, you can also build a customizable sales and retention dashboard that gives you the most important revenue stats at your fingertips.
The best part: all dashboards are built-in to the AccessAlly interface, so you don’t have to worry about broken integrations or duplicate data.
What AccessAlly Customers Are Saying...

"Since being on AccessAlly, my membership site has tripled in the number of members.
The ability to do one-click upsells alone generates 1/4 of my revenue.”
-Marc Wayshak

"Fewer integrations are needed to make it all work
I literally purchased and asked for refunds to 4 other membership/course options because I couldn’t get them to do what I wanted. I knew that AccessAlly would be amazing but I did not realize how amazing. It’s hard to explain but it’s all in the details.
For example it serves as both a membership site and a course plugin. When I tried to use a membership plugin, I had to figure out how to integrate with the course plugin.”
-Ana-Maria Janes
Maximize student learning while keeping an eye on your top business metrics:
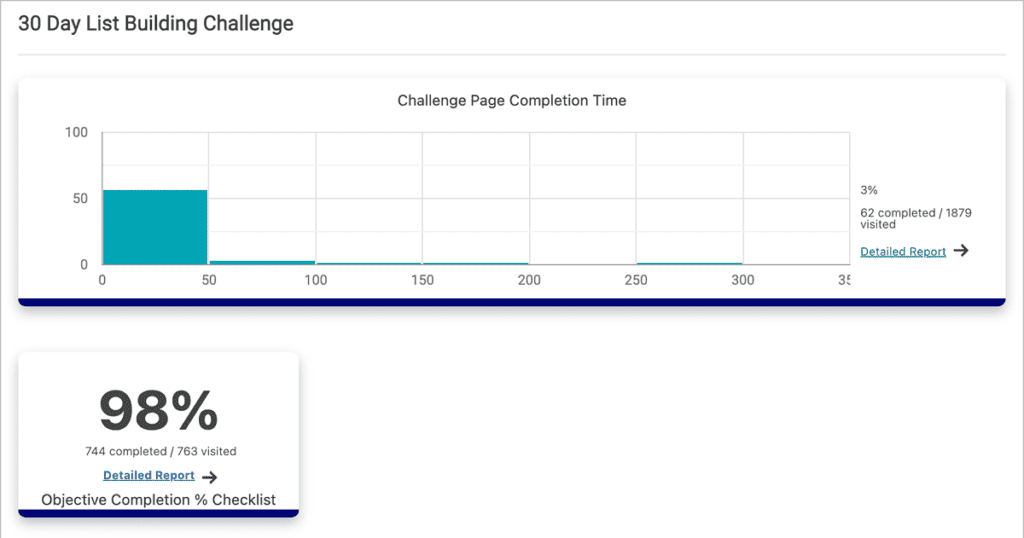
Track Student Login Trends
See the last time a student has logged in, so you can personally or automatically follow-up so no one falls behind.
See Students' Progress in Realtime
Track student progression to ensure they stay on track and help them overcome any roadblocks based on their progress, or lack thereof.
Monitor Quiz Results
See the average score, the number of completed quizzes, and the percentage of the responses selected for each individual question
Review Sales, Refunds, and Cancellations
Know how many users are signing up for your courses and the refund or cancellation percentage at a glance
Measure Retention & Growth
Get insights on how many students are cancelling over time, and the average amount of time they maintain an active account
Project Future Subscription Revenue
Monitor cash-flow and project the long-term health of your business.
Keep Members Engaged with Automated Follow-up and real-time reporting
Get Started TodayLearn more about the features available with AccessAlly’s LMS reporting dashboards
Having the ability to track your students’ progress, sales trends, and retention all under one roof will save you time, and money curating the ultimate user experience backed by results for your online course participants.
Track and Support Individual Users Within a Course or Membership
With AccessAlly’s LMS reporting features you can view each individual student’s progress per course and lesson. You can communicate and support them 1-on-1 through private notes and homework submissions to provide extra guidance and feedback. You can also monitor their login history and digital footprint as they navigate and work their way through your courses.
You’ll know exactly where they are in each course when you track these learning metrics, and how active and engaged they have been with the material so you know where to help them get unstuck if they hit a roadblock.
This is also a great feature to use if your refund policy is based on their level of involvement with the program.
Share the LMS Reporting Dashboard with Key Stakeholders
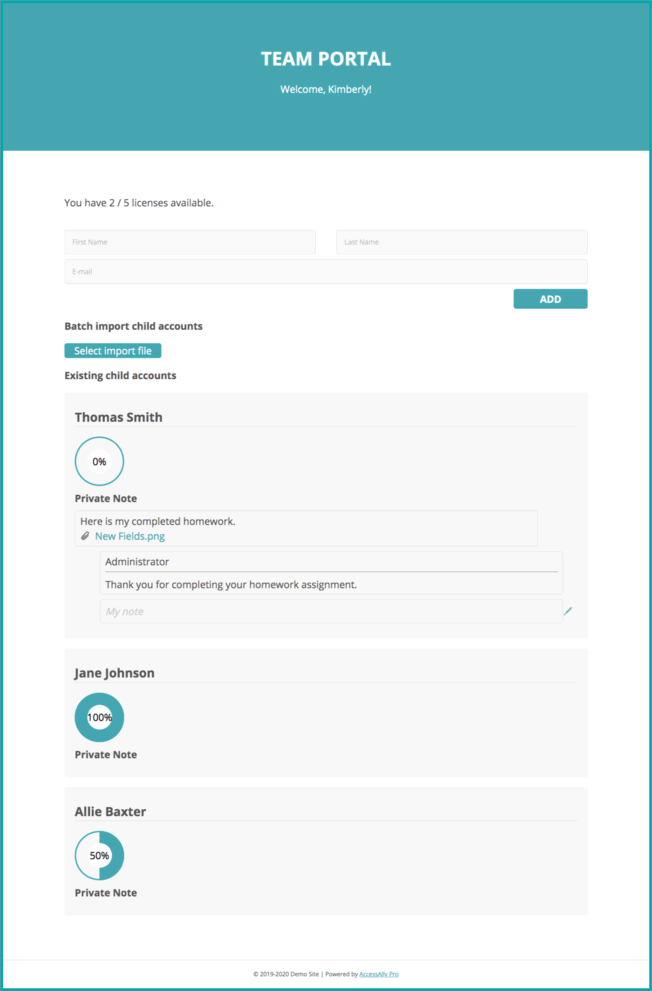
When using AccessAlly’s teams feature for bulk course enrollment you can take advantage of our member directory style LMS reporting dashboards to give team leaders access so they can monitor student progress and help review and manage homework submissions.
For example a school’s principal, teachers, department managers, or district supervisors can have instant access to these progress reports to help them provide the best support and make informed decisions on improvements to the lessons and curriculum.
Another great use case is giving aides or assistants access so they can help review homework submissions and alleviate some of the workload for the team leader.
Monitor and Improve retention rates
AccessAlly’s LMS Reporting features make it possible to monitor engagement levels across all of your courses on an individual level as well as summary for all students so you can track and monitor trends and spot areas that may need a little extra love.
This insight will help you improve your course flow and content to best deliver and reinforce the material, resulting in fewer refunds and cancellations.
This will help you keep churn low and provide a positive experience for all course participants and members.
You may notice students stop logging in after 30 days or only make it halfway through the course. With this data at-hand you can easily pivot your delivery to build in checkpoints along the way so your students keep coming back for more.
With a robust WordPress LMS plugin like AccessAlly you can easily incorporate gamification techniques and automated follow-ups to prevent your students from losing steam and motivate them to keep working towards completion.
In turn, your retention and success rates will increase, and these students will keep coming back to you knowing they’re going to see results. This opens up even more revenue opportunities for you.
Sales based dashboards to track revenue
Take advantage of the revenue reporting dashboards inside AccessAlly to step back and review your revenue numbers in correlation with your course progress and completion reports.
If students are progressing well and you’re receiving a lot of positive feedback it might be time to put together another launch for the course to welcome even more students into the program.
You might also want to build on your success and use this as an opportunity to create an upsell sequence to guide your students to your other products and offerings.
Based on the insights you’re able to gather based on your course data, you may even consider adjusting your pricing based on the improvements you’re making to the course over time.
This may also be a good time to consider a full-fledged recurring membership to increase your recurring revenue numbers if you’ve only been selling individual courses.
Predict Revenue And cash flow with forward projections
One of the most valuable metrics to have in your LMS reporting dashboard is projected or forecasted revenue. Being able to keep a pulse on the projected amount of money coming into your business will set you up for long-term success.
At a glance, you’ll be able to determine whether your projected revenue will successfully keep your business running, and for how long. See projected monthly, quarterly, or yearly revenue.
Track refund and churn trends, and watch as your engagement efforts start to pay off.
This insight can help guide your launch timelines and inform future business decisions to help ensure all operations continue to run without causing you any unnecessary financial stress.
additional metrics to track with your lms reporting dashboard
Recurring Revenue
See the last time a student has logged in, so you can personally or automatically follow-up so no one falls behind.
Customer Lifetime Value
Track student progression to ensure they stay on track and help them overcome any roadblocks based on their progress, or lack thereof.
Churn
See the average score, the number of completed quizzes, and the percentage of the responses selected for each individual question
Daily & Monthly Sales
Know how many users are signing up for your courses and the refund or cancellation percentage at a glance
Abandoned Carts
Get insights on how many students are cancelling over time, and the average amount of time they maintain an active account
Affiliate Sales
Monitor cash-flow and project the long-term health of your business.
